


Hit Every Milestone with Powerful Management Reports
With eResource Scheduler’s forecasting and utilization reports, hitting project goals isn’t luck—it’s data.
With eResource Scheduler’s forecasting and utilization reports, hitting project goals isn’t luck—it’s data.

Resource Management Software Behind Teams Who Lead
From missed milestones to hidden gaps, our resource management reports catch what manual tools miss.
Real-time. Visual. Configurable. And 100% built to keep you two steps ahead.
Calendars don’t tell the whole story—utilization reports do. Track who’s genuinely contributing and who’s just blocked out. View it by resource, role, or project. No more assumptions. Just clean visibility into how your team’s time is really spent.

Stop hoping someone’s free—know it. Availability Reports show you exactly how much unallocated time exists across your team. Identify gaps early, avoid last-minute swaps, and schedule with clarity instead of crossed fingers.

See how much your team can really take before the cracks show. Overloads, shortages, hiring gaps, the capacity report spills it all. You’ll know when to scale up, shift priorities, or hit pause, before chaos hits the schedule.

See where you’re short before it shows up in missed deadlines. These resource management reports compare demand against availability and flag the gaps by role, project, or time period, so you can reassign, hire, or shift priorities before it’s too late.

Monitor financials in real time with reports that pull straight from your schedules and timesheets. See where money’s going, what’s coming in, and how profitable your projects really are—by role, resource, or client.

These timesheet reports show exactly who did what, when, and for how long, pulled straight from submitted timesheets. From billing to project time tracking, they keep your numbers honest and your team accountable, without adding friction to their day.

See how your plans actually played out. Our resource management software compares scheduled hours with what really got logged—so you can spot the gaps, fix the overages, and stop mistaking wishful thinking for project control.

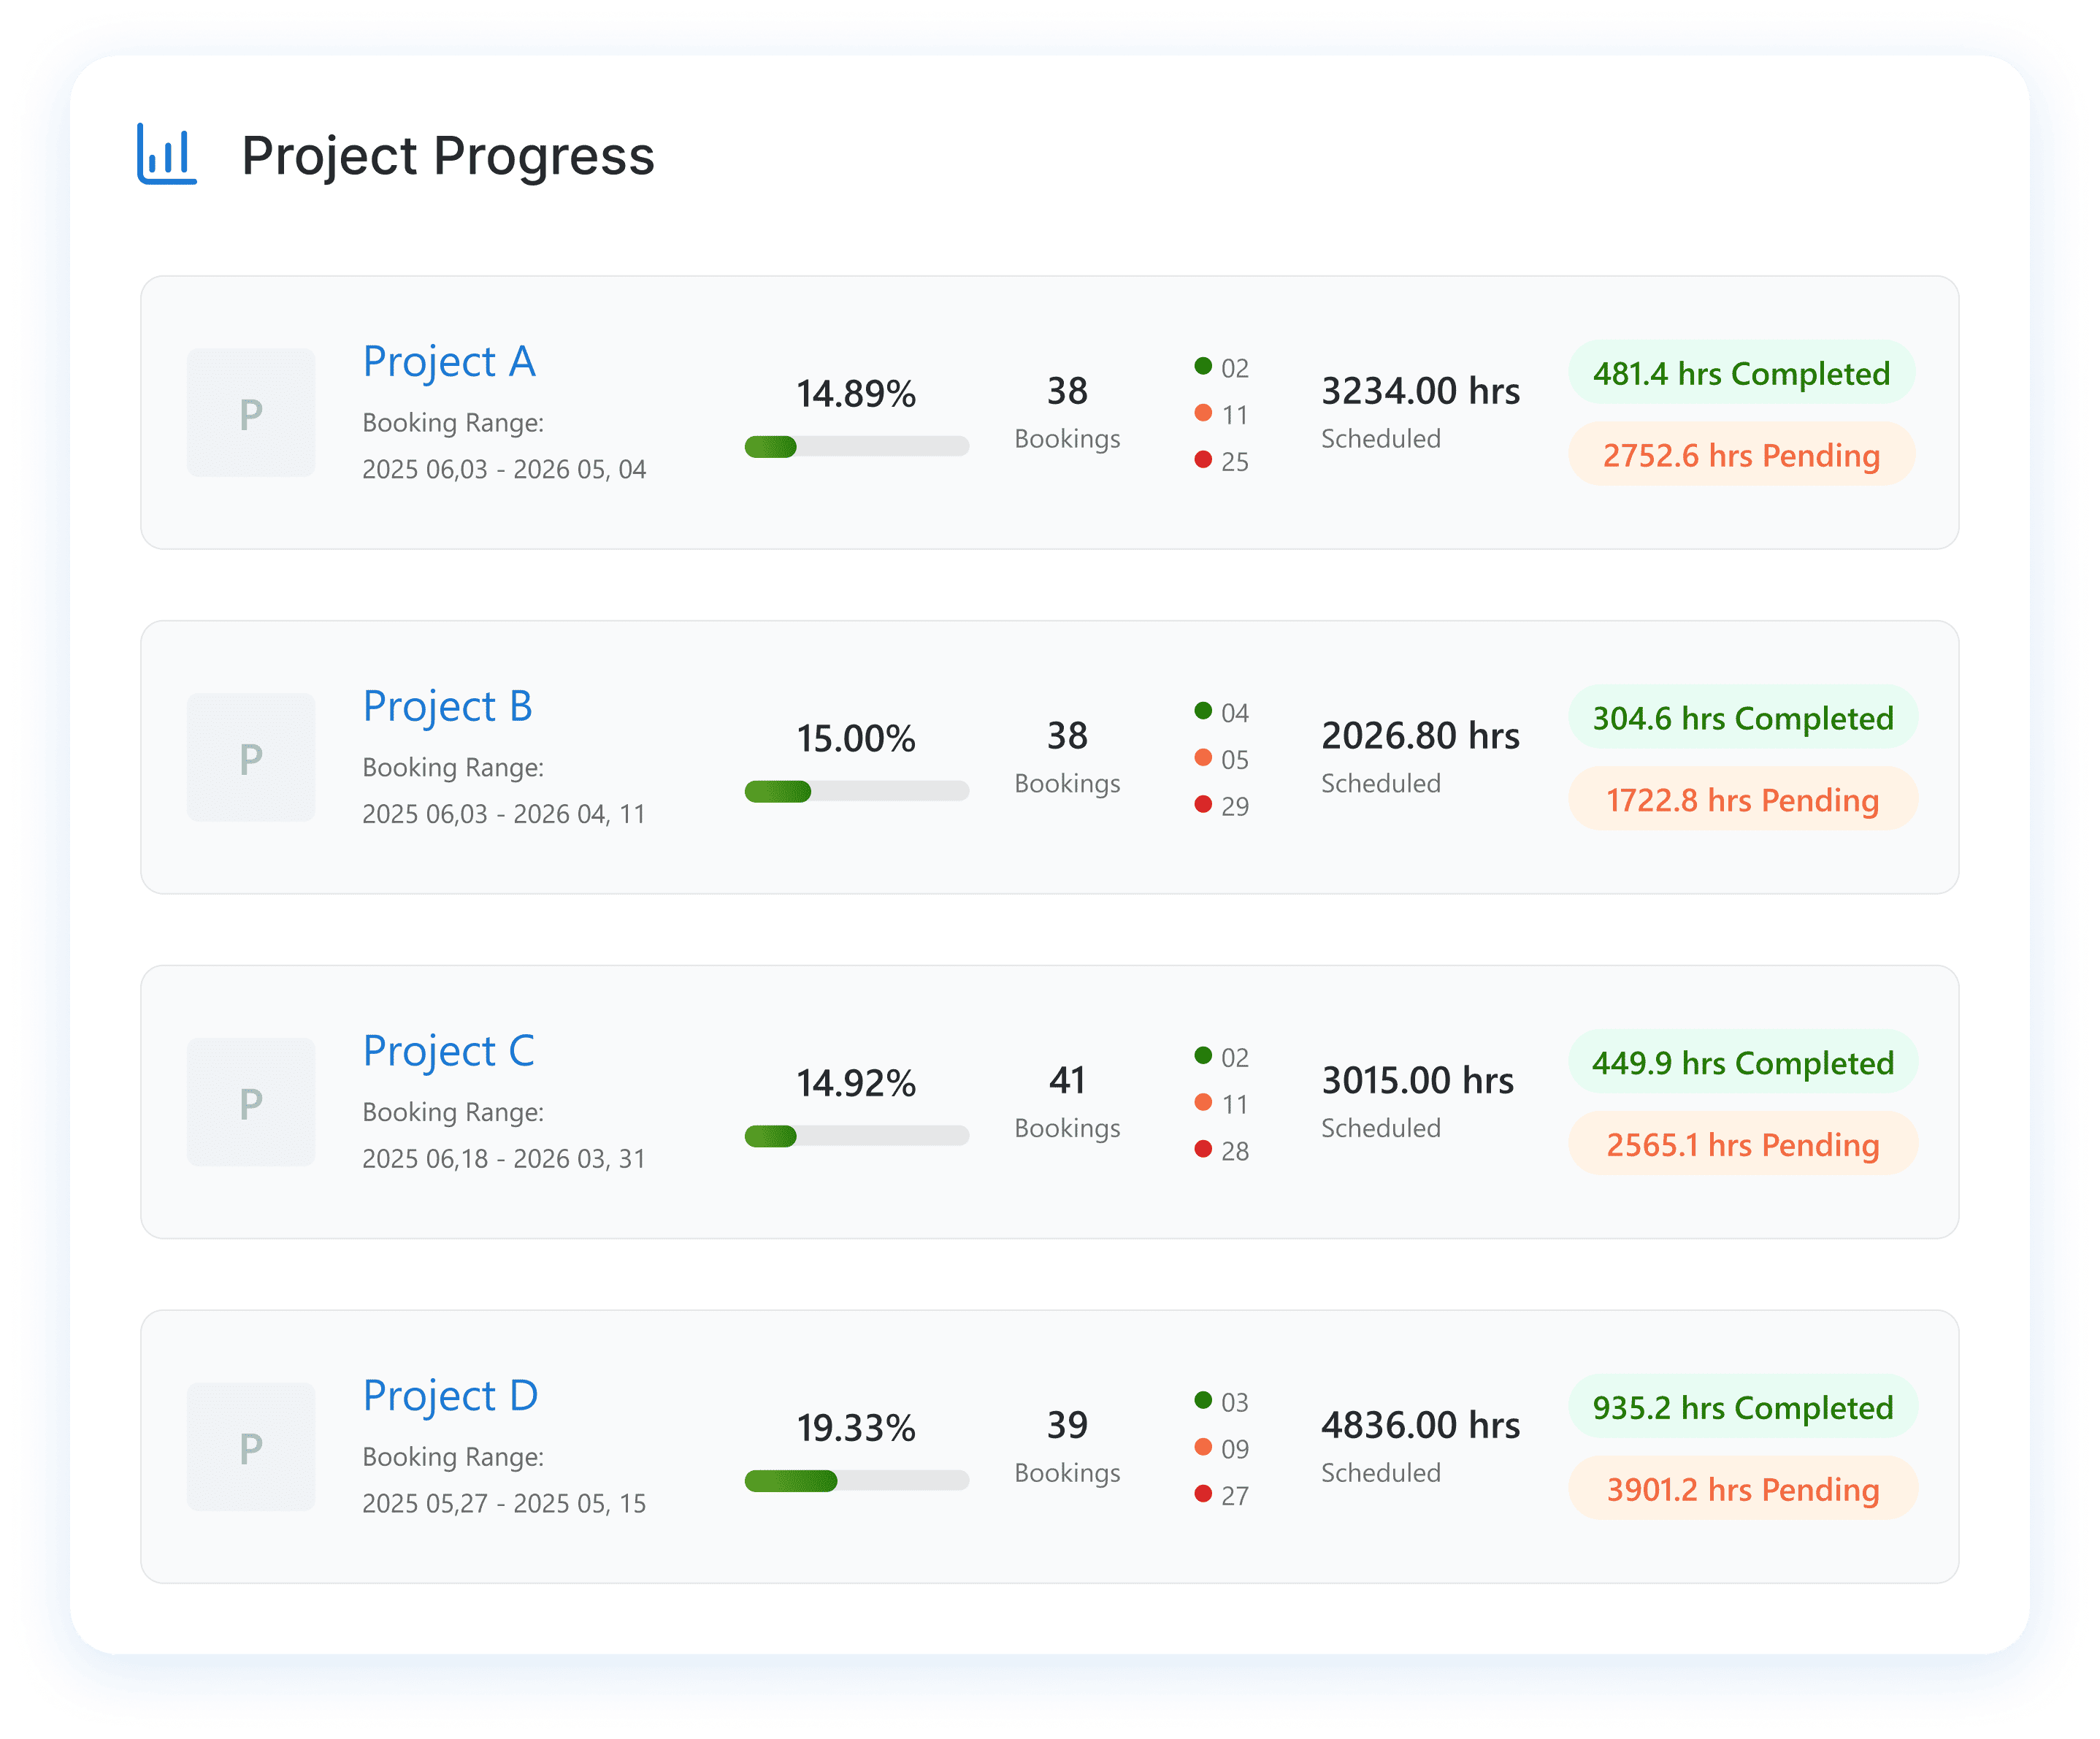
Track what’s done, what’s pending, and what’s falling behind—all in one view. Spot stalled tasks, track completion % by project, and make sure nothing gets stuck in limbo. View timelines, drill into task-level updates, and get the full picture without chasing status reports.
Because cookie-cutter reports are boring.

Set your own color indicators to flag overbooking, underutilization, low availability, and more. It's your data—you decide what pops and what warns.

View data in hours, FTEs, or percentages whatever fits your reporting language. One toggle, multiple perspectives.

Narrow down by resource, project, team, role, or date. Zero clutter. Just the slice of data you actually want to see.

Switch between day, week, or month views. Zoom in for details or zoom out for patterns-without losing the big picture.

Download reports in Excel without breaking the format. No cleaning, no rework—just plug-and-play files your team can actually use.

No tiptoeing around the data. These visuals speak in bars, stacks, lines, and trends, showing exactly where things spike, stall, or shine. The patterns pop before problems do.
See what’s possible when scheduling meets eResource Scheduler.
eResource Scheduler's
Accounting & Audit Firms
Staff every audit with the right expertise, hit every filing deadline, and keep billable hours from slipping away.
Engineering
Match certified engineers to the right project phase, eliminate double-bookings, and deliver complex builds without the rework.
Construction & Architecture
Keep architects, contractors, and field crews
in sync across every site, every phase, and every deadline.
Management Consultancies
Keep consultants billable, bench time minimal, and every client engagement staffed with exactly the right expertise.
Information Technology
Balance sprints, support queues, and infrastructure work across your dev, QA, and ops teams without the conflict.
Professional Services
Whether it's law, advisory, or creative work, align the right talent to every brief and bill every hour with confidence.
Connect eResource Scheduler to your favorite apps and system, so your scheduling stays in sync without extra effort.

With eResource Scheduler, Pini Group moved from fragmented spreadsheets to clear, data-driven oversight. Centralized management reports provided leadership with accurate utilization data, early risk visibility, and actionable insights. Teams aligned faster, resources were distributed smarter, and project delivery became more controlled, transparent, and scalable across geographically dispersed operations supporting sustained growth and confident executive planning.
Read More
In eRS, you can generate reports on resource utilization, availability, planned vs actual, resource gaps and capacity forecast, timesheets, project progress, and financials to get a clear view of workloads, track performance, and make informed project decisions.
Yes. eRS, our resource planning software, lets you export reports to Excel, PDF, or other common formats, providing plug-and-play files your team can actually use without cleaning or rework.
Yes. a resource planning software like eResource Scheduler offers real-time dashboards that display resource utilization and availability across projects. You can filter and sort data by role, team, project type, location, or skills to get a clear view of your team's workload and ensure optimal resource allocation.
eRS management reports include availability and utilization reports that show who’s free, busy, or overbooked. You can apply custom color rules to flag overbooking, underutilization, or low availability, making it easy to spot issues and adjust assignments before they impact projects.
Yes. eRS resource gap reports compare resource demand against availability across projects and time periods. They highlight shortages by role or project, so you can reassign tasks, hire, or adjust priorities before gaps affect delivery.
eRS project progress reports show what’s done, what’s pending, and what’s falling behind in a single view. You can track completion percentages, spot stalled tasks, and drill down to task-level updates to keep projects on track without chasing status updates.
eRS planned vs actual and utilization reports show the difference between scheduled hours and what was actually worked. You can see who’s truly contributing versus who’s just booked, track this by resource, role, or project, and address gaps or overages effectively.
Yes. eRS, a powerful resource capacity planning software, compares planned and actual hours to reveal gaps and overages. By reviewing this data alongside Capacity Reports, you can plan future projects more accurately and avoid overloading your team.
In eRS, you can customize reports to fit your workflow by switching between day, week, or month views and zooming in or out as needed. You can also set custom color rules to flag overbooking, underutilization, or low availability, so your reports highlight what matters most to you.
Yes. Reports generated in our resource planning management software are client-ready with clear data in hours, FTEs, or percentages, interactive graphs showing trends, and exportable Excel files that need no extra formatting.
 ALL FEATURES INCLUDED